Read a river's water quality from five measurements.
WaterMirror turns dissolved oxygen, BOD, ammonia nitrogen, conductivity and suspended solids into a WQI5 score, a quality band and a status for each indicator. Use the Android app, call the open API, or run the whole service on a Jetson Nano.
- Android app 2.3.7
- API 2.3.0 on PyPI
- Runs on x86 and ARM64
- DO
- Dissolved oxygen
- % saturation
- BOD
- Biochemical oxygen demand
- mg/L
- NH₃-N
- Ammonia nitrogen
- mg/L
- EC
- Electrical conductivity
- µS/cm
- SS
- Suspended solids
- mg/L
What you can do with the app
Enter a sample or upload a CSV
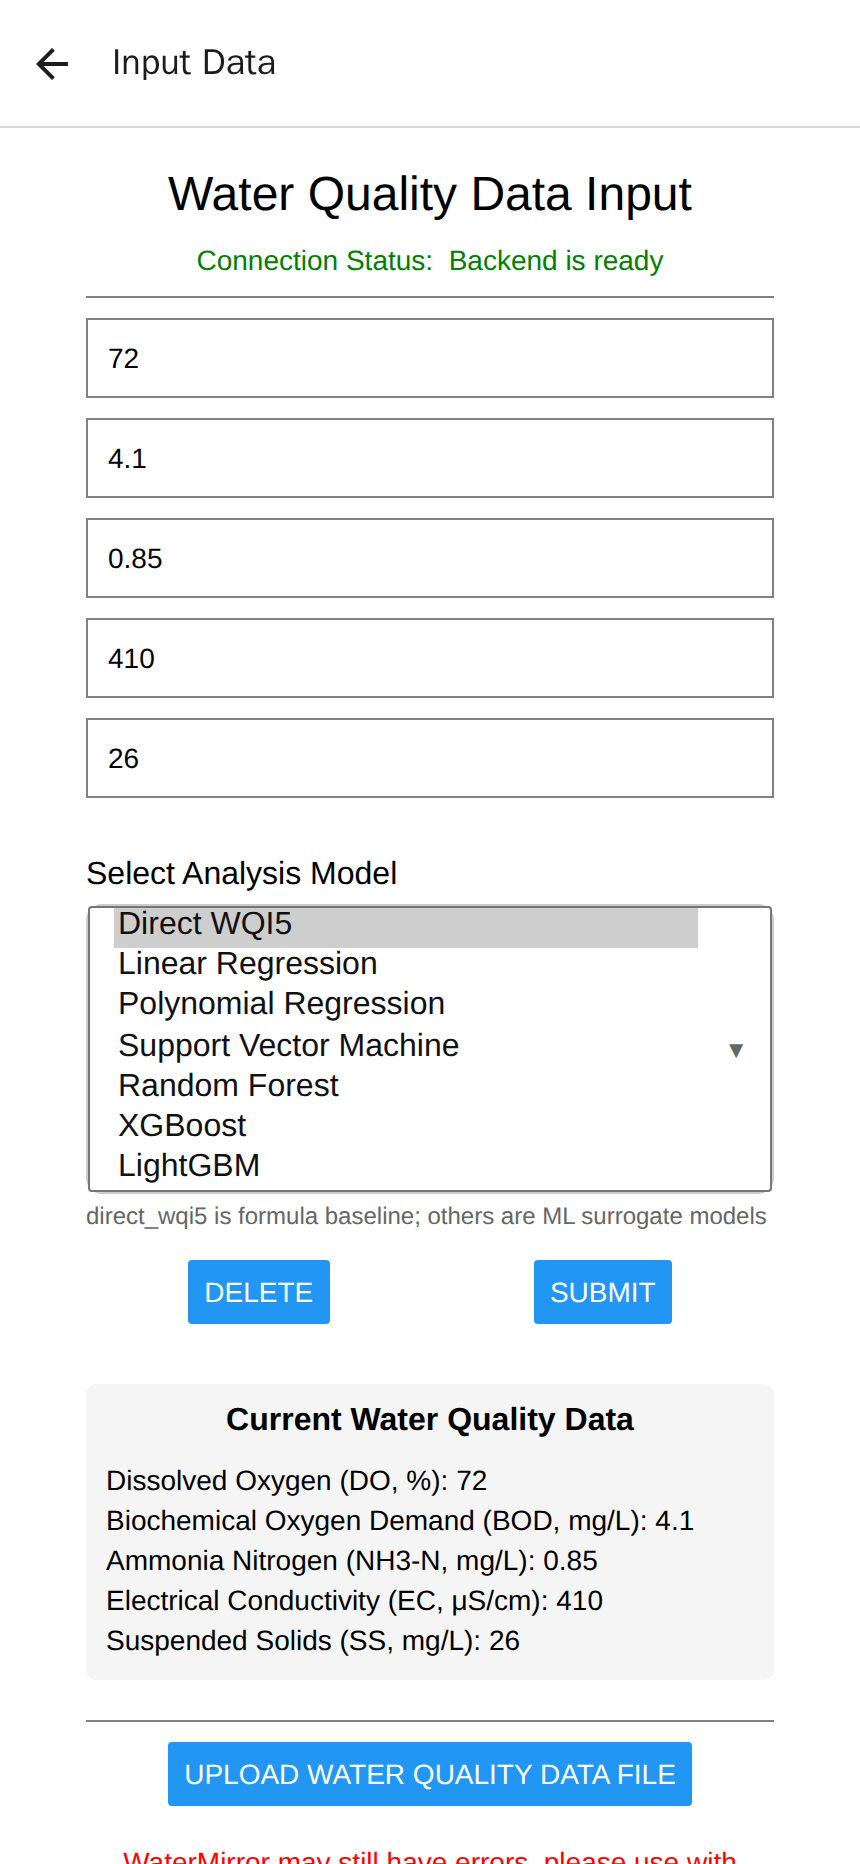
Type five values by hand, or upload a CSV with the header
DO,BOD,NH3N,EC,SSto assess a batch.Choose how the score is computed
Use the direct WQI5 formula, or compare it with one of six trained models: linear, polynomial, SVM, random forest, XGBoost or LightGBM.
See what the score means
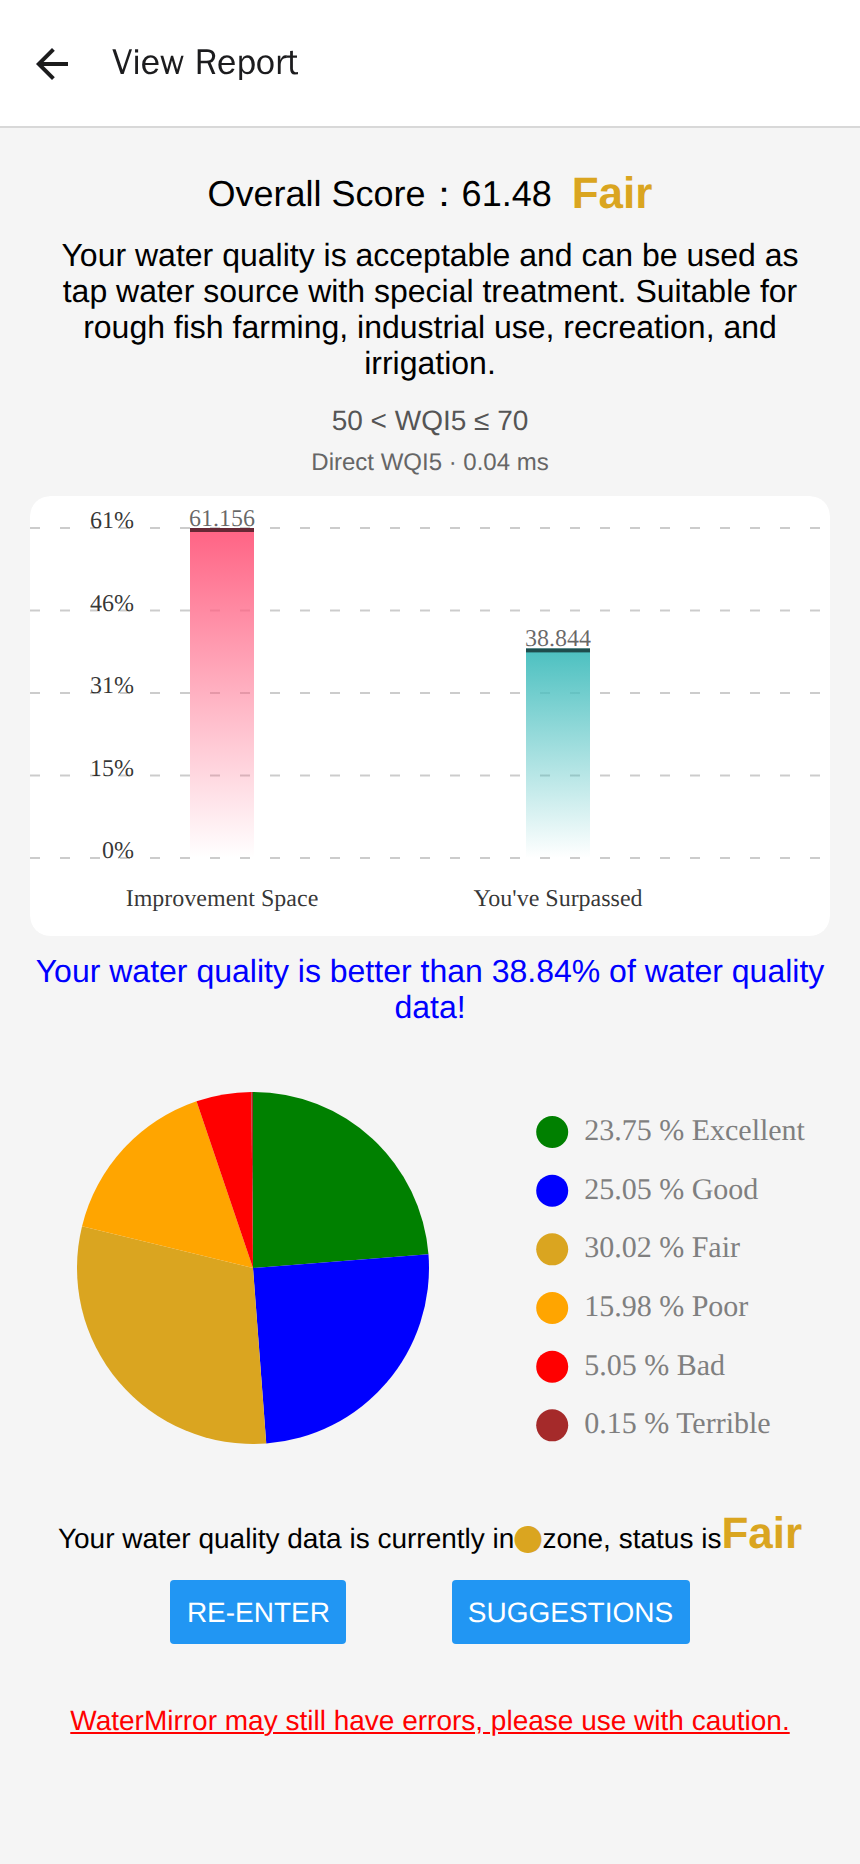
The report shows the score, its band and range, how each indicator rates, where the sample sits in the reference data, and any input warnings.
Connect to your own server
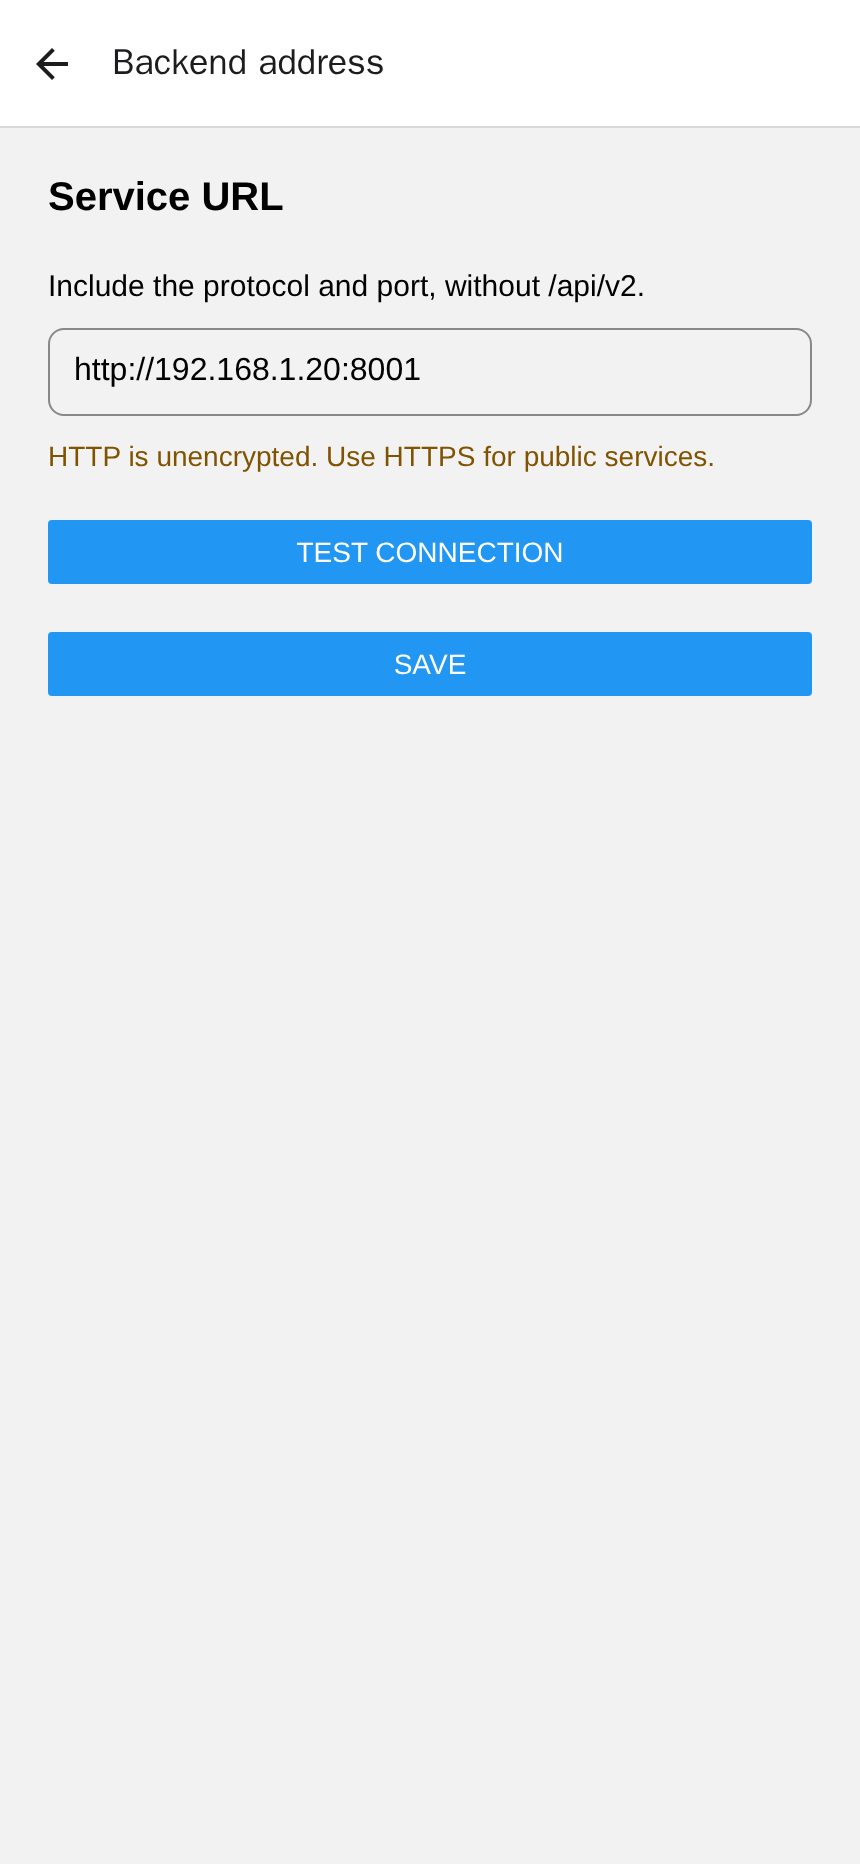
Enter a backend address in Backend settings and test its health and readiness before you send data. The address stays saved on the phone.
Use it in your language
English, Traditional Chinese, Simplified Chinese and Japanese.
How a reading becomes a score
- 1
Measure
Collect DO, BOD, NH₃-N, EC and SS at a sampling point.
- 2
Send
The app posts the values to a WQSurrogateModels API at
/api/v2/assessment. - 3
Assess
The API validates the input, then computes WQI5 with the formula or the model you picked.
- 4
Read
The app shows the score, band, range, per-indicator status and warnings that the API returns.
The WQI5 formula
Each indicator is converted to a sub-index between 0 and 100. WQI5 is the equal-weighted mean of the five, rounded to three decimals.
WQI5 = (QDO + QBOD + QNH₃-N + QEC + QSS) ÷ 5
The app never scores data on its own. The API is the single source of truth, so every client gets the same answer.
WaterMirror app
Android app built with Expo and React Native
WQSurrogateModels API
FastAPI service with the formula and the trained models
Where the API runs
Any x86 server or PC
Jetson Nano 2GB in Docker (ARM64)
Six bands, each with a use
The API places every score in one of six bands. The app then explains what water in that band is suitable for.
| Excellent85 < WQI5 ≤ 100 | Suitable for all uses. Drinkable after chlorine disinfection. |
|---|---|
| Good70 < WQI5 ≤ 85 | Suitable as a tap-water source and for aquaculture, industry, recreation and irrigation. |
| Fair50 < WQI5 ≤ 70 | A tap-water source only after special treatment. Suitable for rough-fish farming, industry, recreation and irrigation. |
| Poor30 < WQI5 ≤ 50 | Suitable only for irrigation or industrial cooling. |
| Bad15 < WQI5 ≤ 30 | Not offensive, and usable for environmental conservation. |
| Terrible0 ≤ WQI5 ≤ 15 | May produce odours. |
The formula is the reference. The models are for comparison.
With all five readings, the direct WQI5 formula is the default and the reference. Six regression models were trained to approximate it, so their accuracy and running cost can be compared, including in experiments where indicators are missing.
| Model | MAE | R² |
|---|---|---|
| XGBoost | 0.264 | 0.9996 |
| LightGBM | 0.288 | 0.9995 |
| Random Forest | 0.338 | 0.9990 |
| SVM | 1.916 | 0.9813 |
| Polynomial regression | 5.160 | 0.8995 |
| Linear regression | 7.556 | 0.7803 |
Averaged over five repeated splits. Error is measured against the dataset's Score column. The formula itself differs from that column (MAE 6.07) and the cause is still under investigation, so a lower error does not make a model more correct than the formula.
The research dataset and trained model files are not distributed. The formula works out of the box; trained models must be supplied locally.
When a reading is missing
The formula needs all five readings, but BOD is a five-day lab test and NH₃-N is usually analysed in a lab too, so field data often arrives incomplete. The research tested two ways to keep scoring: retrain a model on the indicators you have, or fill in the missing one from the others first. Both were checked on 10,714 records the models never saw during training.
Missing NH₃-N
Uses DO, BOD, EC, SS
Usable as an estimate
- Retrain without it
- MAE 2.37R² 0.95
- Fill it in from the others first
- MAE 2.40R² 0.95
Missing BOD
Uses DO, NH₃-N, EC, SS
Not reliable
- Retrain without it
- MAE 14.12R² −0.02
- Fill it in from the others first
- MAE 12.14R² 0.10
Missing BOD and NH₃-N
Uses DO, EC, SS
Not reliable
- Retrain without it
- MAE 14.72R² −0.14
- Fill it in from the others first
- MAE 12.89R² −0.01
MAE is in WQI5 points; lower is better. An R² below 0 means the estimate does worse than always guessing the average score.
NH₃-N can be estimated from the other four indicators to within about 2.4 points. BOD cannot: without it, the error rises to 12–15 points, so BOD is the indicator that has to be measured.
These are research results. The app and API currently score complete five-indicator records only.
Tested on a 2 GB Jetson Nano
The same API runs in Docker on a Jetson Nano 2GB with four Cortex-A57 cores, using the CPU only. Training stays off the device.
| Scoring method | 95th percentile | Median |
|---|---|---|
| Direct WQI5 | 7.42 ms | 6.41 ms |
| XGBoost | 17.42 ms | 15.52 ms |
| LightGBM | 17.57 ms | 15.67 ms |
| Random Forest | 163.81 ms | 146.90 ms |
Warm one-row HTTP requests over the device's loopback, MAXN power mode, 300 requests per method. Cold model loading is measured separately.
597 of 610
Replay jobs that match x86
The full experiment set was rerun on the Nano and compared with x86 within an absolute tolerance of 1e-6. The 13 that differ are missing-indicator reconstructions in linear and polynomial models, where ill-conditioned coefficients amplify tiny floating-point differences.
2.1.4 → 3.2.0
A wrong-score bug, caught
The first Nano deployment used XGBoost 2.1.4. It loaded the model without an error but returned wrong scores. Comparing against the x86 reference exposed it, and pinning 3.2.0 fixed it.
1.05 GB
Random forest is the heavy one
That is the size of the production random forest file. It takes 168 s to load cold and peaks at 1.2 GiB of memory on a device with 1.9 GiB. A 200-tree version is a third smaller for 0.33% more error; it stays a candidate until a full confirmation study.
Get started
Install the app
Download the APK, open Backend settings and enter the address of a running API, for example http://192.168.1.20:8001.
Run the API
Needs Python 3.10 or newer. The direct formula needs no model files.
git clone https://github.com/KageRyo/WQSurrogateModels.git
cd WQSurrogateModels
uv sync
uv run python main.py
The runtime is also on PyPI as wqsurrogatemodels.
Call it from anything
Any HTTP client can use the endpoint the app uses.
curl -X POST http://localhost:8001/api/v2/assessment \
  -H "Content-Type: application/json" \
  -d '{"DO":70,"BOD":2,"NH3N":0.3,"EC":400,"SS":10,
       "model_type":"direct_wqi5"}'

{"score": 75.685, "category": "Good",
 "rating_range": "70 < WQI5 ≤ 85", ...}